Data Viewer
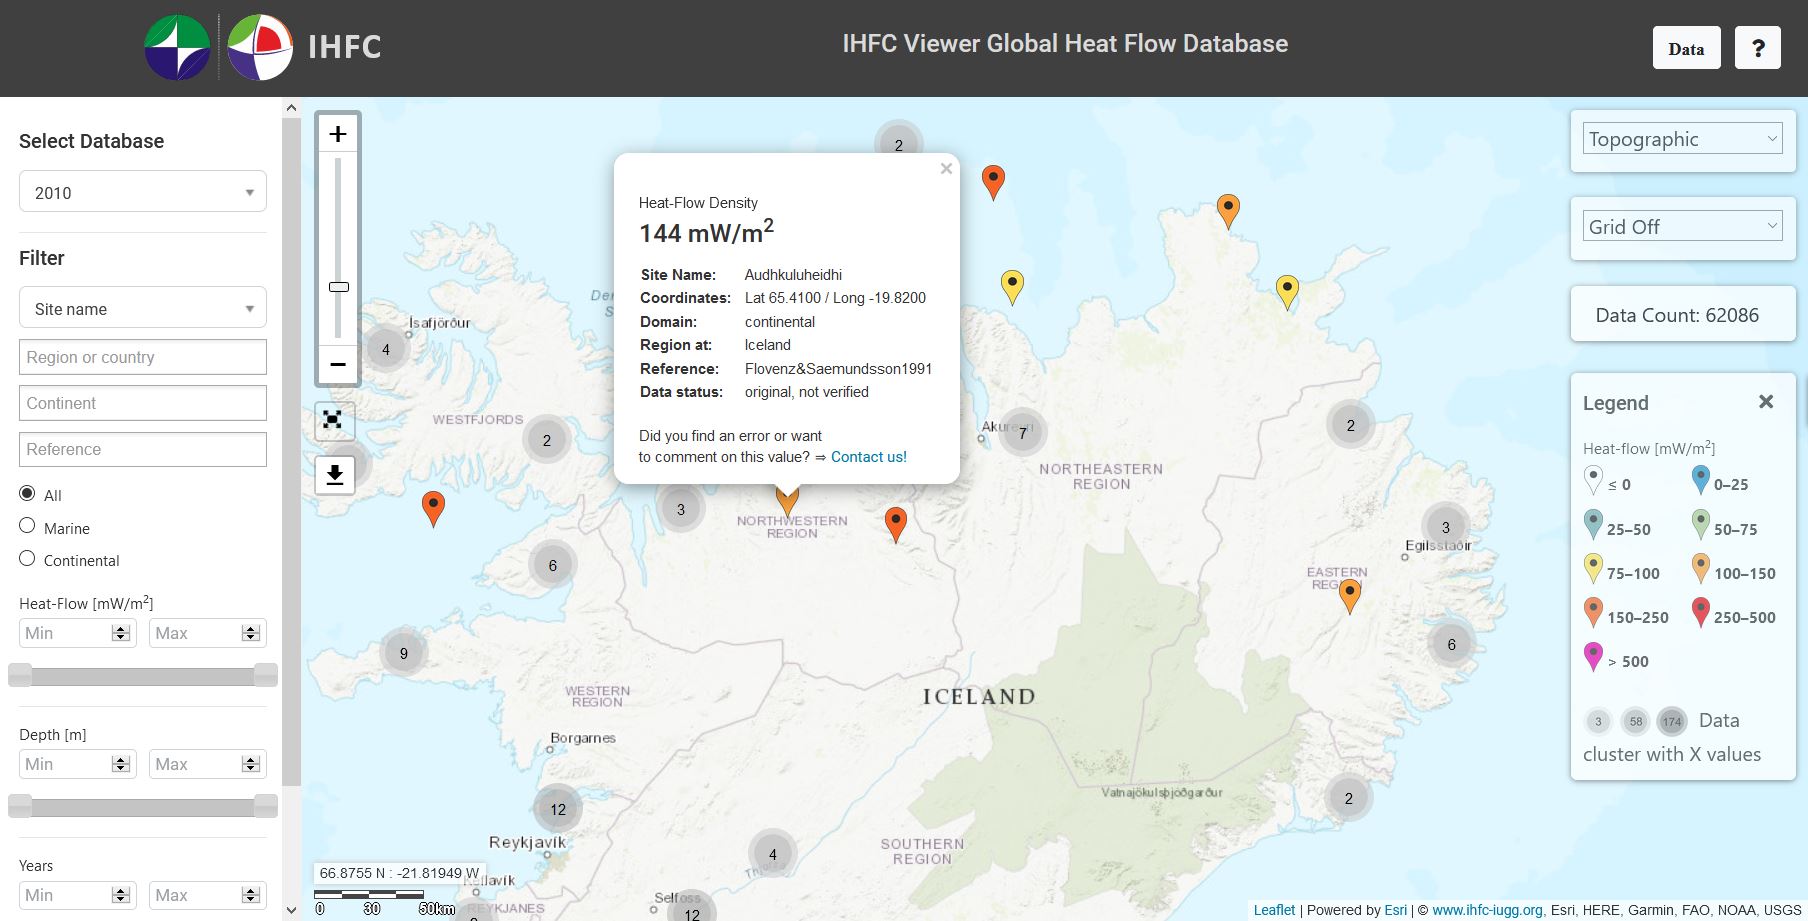
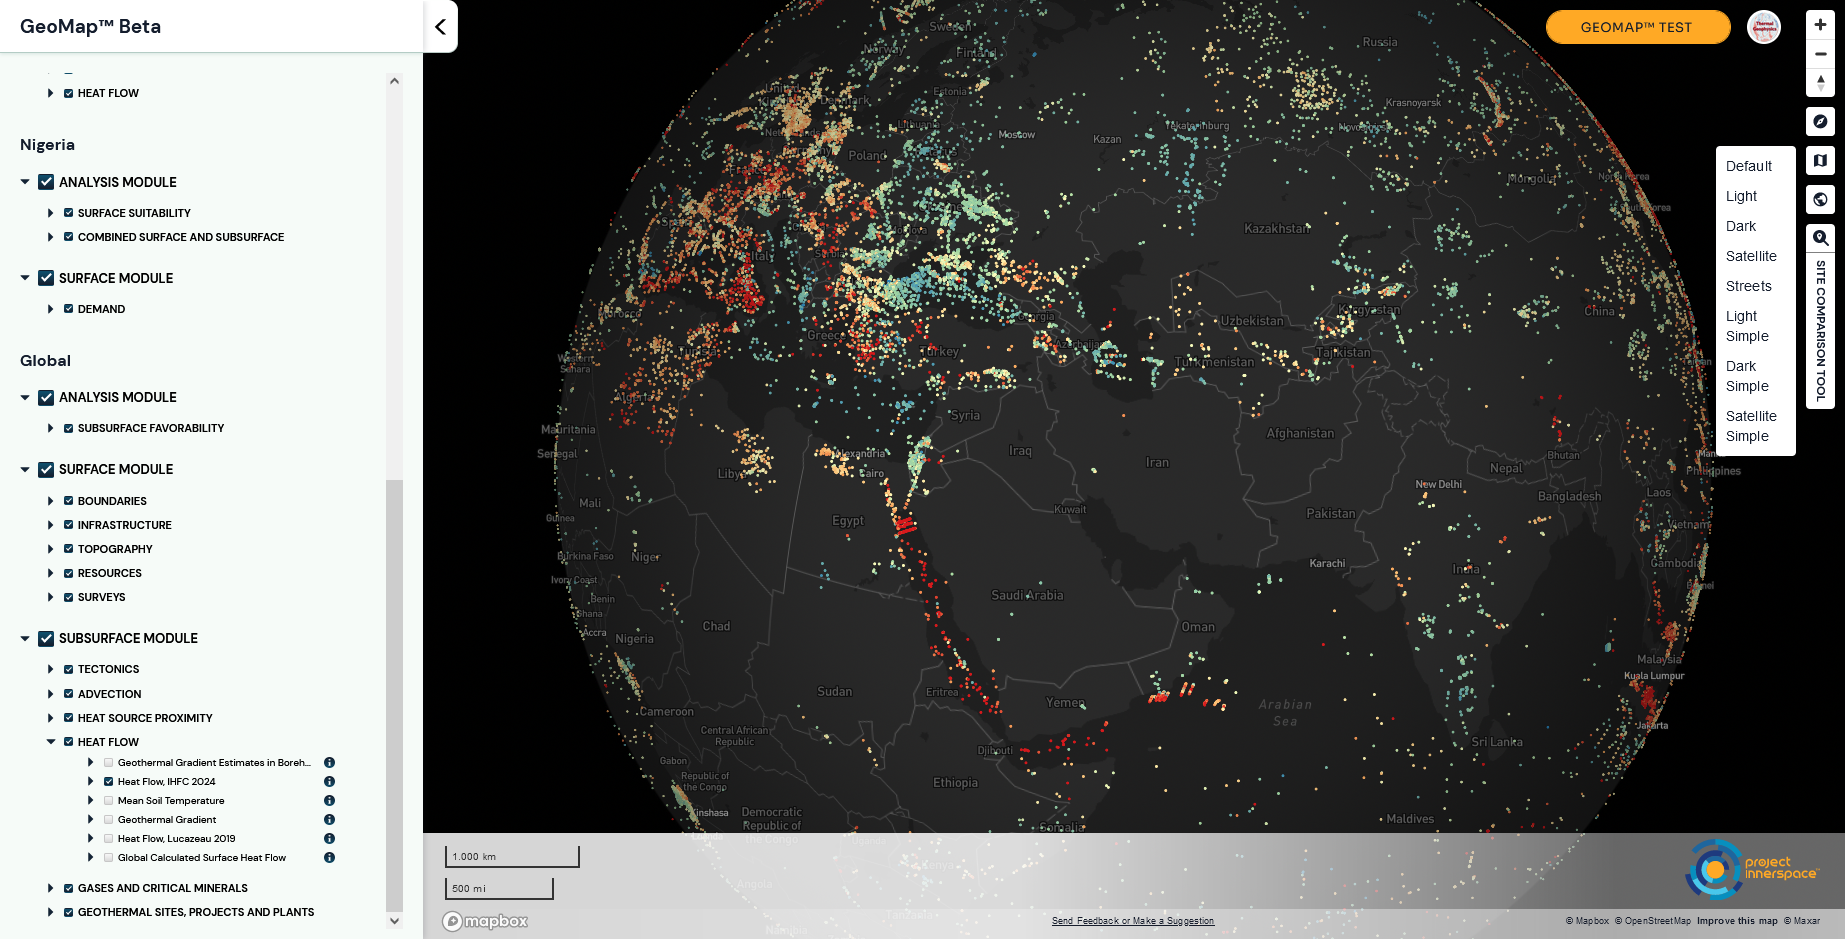
External Visualization
Find here a compilation of visualizations of the global heat flow data with a state of data described here.


Global heat flow mapping studies
Several research studies aim to map the data of the global heat-flow database. Here, we compile published studies that have produced or analysed global representations of terrestrial heat flow.
Mousavi & Mousavi (2026)
Mousavi, N., Mousavi, S.M. (2026). Optimizing feature selection for global geothermal heat flow prediction using machine learning. Scientific Reports. doi:10.1038/s41598-026-63610-z
Data used: IHFC data release 2021
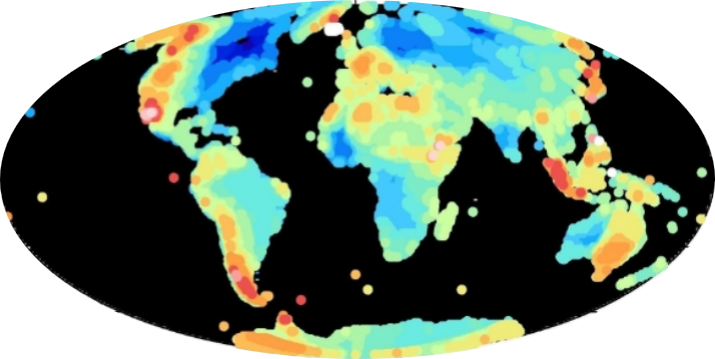
Mapping: Develops a machine-learning framework for global continental geothermal heat-flow prediction with particular emphasis on selecting physically meaningful predictors. Multiple feature-selection approaches identify six dominant variables: distances to the five nearest volcanoes, hotspots and trenches, heat-production province, Moho depth, and lithosphere-asthenosphere boundary depth. These predictors are used in an ensemble machine-learning framework to generate a new global prediction for continental regions. The study reports an ensemble-based prediction uncertainty of approximately 8 mW/m² and demonstrates that a relatively small set of geologically meaningful variables can reproduce first-order global continental heat-flow variations.

Zhang et al. (2025)
Zhang, Y., Cheng, Q., Hong, T., Ji, J. (2025). Ocean singularity analysis and global heat flow prediction reveal anomalous bathymetry and heat flow. Geoscience Frontiers, 16, 102013. doi:10.1016/j.gsf.2025.102013
Data used: IHFC data release 2024
Mapping: Develops a data-driven global heat-flow prediction using heat-flow observations together with geological and geophysical observables. The study combines singularity analysis with a similarity-based prediction approach to characterize the global heat-flow field and places particular emphasis on oceanic regions and mid-ocean-ridge thermal anomalies. Rather than relying exclusively on lithospheric cooling models, the method uses spatial relationships between measured heat flow and multiple geological and geophysical parameters to predict heat flow in poorly sampled regions. Differences between the predicted field and background oceanic trends are further evaluated to identify anomalous heat-flow and bathymetric domains potentially associated with hydrothermal circulation and ridge processes.
Lucazeau (2019)
Lucazeau, F. (2019). Analysis and Mapping of an Updated Terrestrial Heat Flow Data Set. Geochemistry, Geophysics, Geosystems, 20(8), 4001-4024. doi:10.1029/2019gc008389
Data used: Own data - New Global Heat Flow (NGHF) compilation
Mapping: generalized similarity method, global 0.5° × 0.5° grid
Google Earth file of global heat-flow interpolation - Lucazeau (2019)
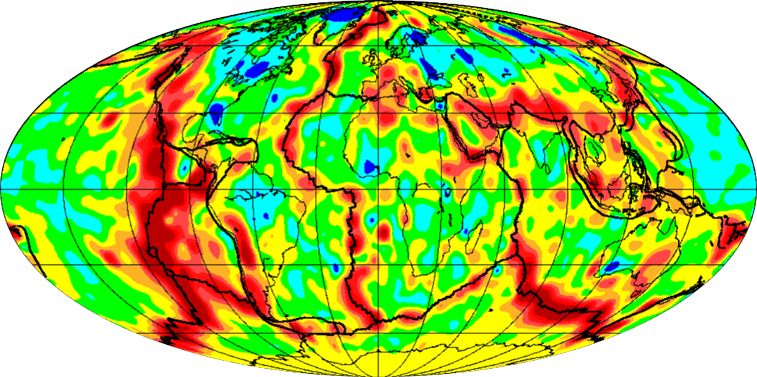
Vieira & Hamza (2018)
Vieira, F.P., Hamza, V.M. (2018). Global Heat Flow: New Estimates Using Digital Maps and GIS Techniques. International Journal of Terrestrial Heat Flow and Applied Geothermics, 1(1), 6-13. doi:10.31214/ijthfa.v1i1.6
Data used:
Mapping: Uses digital geological and geophysical maps together with GIS techniques to derive a global heat-flow representation on a 1° × 1° grid. Continental regions are subdivided according to tectonic and geological provinces and assigned representative heat-flow values derived from observations and empirical relations with tectono-thermal age. Oceanic regions are classified according to ocean-floor age. The approach combines observational heat-flow data with predicted values in areas without direct measurements and applies weighting according to tectonic context. The resulting global map is intended to provide a spatially complete heat-flow field while avoiding the very high heat-flow predictions for young oceanic lithosphere produced by simple half-space cooling models.
Mareschal et al. (2017)
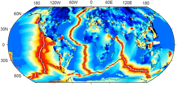
Mareschal, J.-C., Jaupart, C., Iarotsky, L. (2017). The Earth Heat Budget, Crustal Radio-activity and Mantle Geoneutrinos. In L. Ludhova (Ed.), Neutrino Geoscience (pp. 4.1-4.46): Open Academic Press.
Data used:
Mapping: interpolation between continental heat flow data points; in the oceans it uses a plate cooling model to predict the heat flow as a function of sea floor age.
Davies (2013)
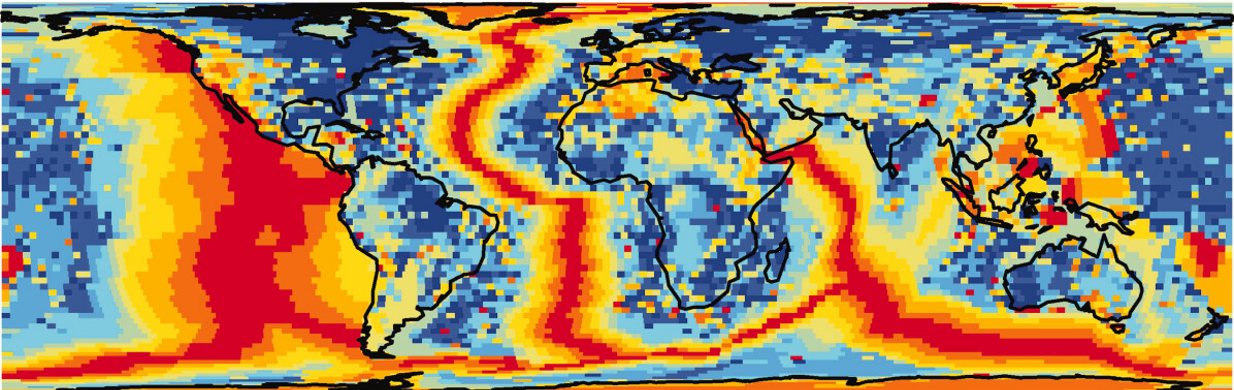
Davies, J.H. (2013). Global map of solid Earth surface heat flow. Geochemistry, Geophysics, Geosystems, 14, 4608-4622. doi:10.1002/ggge.20271
Data used:
Mapping: A global map of surface heat flow is presented on a 2° × 2° equal-area grid, based on more than 38,000 heat-flow measurements. Three approaches are combined. For young oceanic crust (<67.7 Ma), heat flow is estimated from a half-space cooling model rather than directly from observations because measurements are frequently affected by hydrothermal circulation. In other regions with sufficient data coverage, observed heat-flow measurements are used. For remaining data-poor regions, heat flow is estimated from correlations with geological setting. The combined approach produces a spatially complete global surface heat-flow field.
Goutorbe et al. (2011)
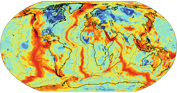
Goutorbe, B., Poort, J., Lucazeau, F., Raillard, S. (2011). Global heat flow trends resolved from multiple geological and geophysical proxies. Geophysical Journal International, 187(3), 1405-1419. doi:10.1111/j.1365-246X.2011.05228.x
Data used: Updated version of the global database of Pollack et al. (1993)
Mapping: Integrates multiple proxies derived from a large body of global geological and geophysical data sets. Two simple empirical methods are used: both of them are based on a set of examples, where heat flow measurements are associated with relevant terrestrial observables such as surface heat production, upper-mantle velocity structure, tectono-thermal age, on a 1°× 1° grid. To a given target point owning a number of observables, the methods associate a heat flow distribution rather than a deterministic value to account for intrinsic variability and uncertainty within a defined geodynamic environment. The ‘best combination method’ seeks the particular combination of observables that minimizes the dispersion of the heat flow distribution generated from the set of examples. The ‘similarity method’ attributes a weight to each example depending on its degree of similarity with the target point.
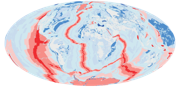
Davies & Davies (2010)
Davies, J. H., Davies, D. R. (2010). Earth's surface heat flux. Solid Earth, 1(1), 5-24. doi:10.5194/se-1-5-2010
Data used: IHFC GHFDB Release 2010/2011
Mapping: oceanic: accounts for hydrothermal circulation in young oceanic crust by utilising a half-space cooling approximation. Continental: estimate the average heat flow for different geologic domains as defined by global digital geology maps; and then produce the global estimate by multiplying it by the total global area of that geologic domain. The averaging is done on a polygon set which results from an intersection of a 1° equal area grid with the original geology polygons
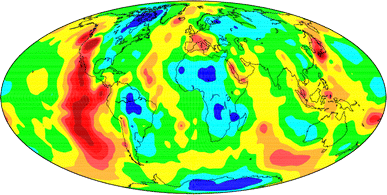
Hamza et al. (2008)
Hamza, V.M., Cardoso, R.R., Ponte Neto, C.F. (2008). Spherical harmonic analysis of Earth's conductive heat flow. International Journal of Earth Sciences, 97(2), 205-226. doi:10.1007/s00531-007-0254-3
Data used: Updated version of the global database of Pollack et al. (1993)
Mapping: Represents the global conductive heat-flow field by spherical harmonic analysis. Available heat-flow measurements are first averaged within 5° × 5° grid cells and used to derive spherical harmonic coefficients describing the large-scale spatial variation of terrestrial heat flow. The approach provides a continuous global representation from irregularly distributed observations and allows comparison of long-wavelength heat-flow patterns with earlier harmonic models. Because predictions in regions without measurements depend on the harmonic representation rather than direct geological constraints, the reliability of the resulting field varies with observational coverage.
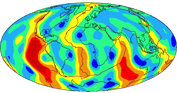
Pollack et al. (1993)
Pollack, H.N., Hurter, S.J., Johnson, J.R. (1993). Heat flow from the Earth's interior: Analysis of the global data set. Reviews of Geophysics, 31(3), 267-280. doi:10.1029/93RG01249
Input data: New global heat-flow compilation assembled by Pollack et al. (1993), comprising 24,774 observations at 20,201 sites and extending earlier global compilations including Lee & Uyeda (1965) and Jessop et al. (1976). Measurements cover approximately 62% of the Earth's surface on a 5° × 5° grid. Empirical geological estimators are used for unsurveyed regions, while theoretical cooling-model values are introduced for young oceanic lithosphere to account for hydrothermal heat transport.
Mapping: Based on a global compilation of 24,774 heat-flow observations at 20,201 sites. Measurements are evaluated on a 5° × 5° global grid, with observational coverage extending over about 62% of the Earth's surface. For grid cells without measurements, empirical heat-flow estimators are assigned according to geological characteristics of the corresponding map units. The completed global field is additionally represented by spherical harmonic analysis, allowing characterization of the long-wavelength structure of surface heat flow and estimation of the Earth's total heat loss.
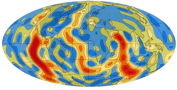
Chapman et al. (1979)
Chapman, D.S., Pollack, H.N., Čermák, V. (1979). Global Heat Flow with Special Reference to the Region of Europe. In: Čermák, V., Rybach, L. (eds), Terrestrial Heat Flow in Europe, Springer, Berlin, Heidelberg, pp. 41-48. doi:10.1007/978-3-642-95357-6_2
Data used:
Mapping: Discusses the global heat-flow map derived from measured observations supplemented in unsampled regions by empirical prediction based primarily on tectonic setting and tectono-thermal age. The global representation is used as the basis for examining the European heat-flow field, where long-wavelength patterns are dominated by high heat flow in southern Europe, the Mediterranean and North Atlantic and lower values over the East European Platform. The study therefore represents an application and regional interpretation of the global mapping framework developed by Chapman & Pollack rather than an entirely independent global compilation.
Chapman & Pollack (1975)
Chapman, D.S., Pollack, H.N. (1975). Global heat flow: A new look. Earth and Planetary Science Letters, 28(1), 23-32. doi:10.1016/0012-821X(75)90069-2
Data used:
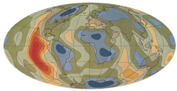
Mapping: Produces a spatially complete global heat-flow map by combining available measurements with empirical estimates for unsurveyed regions. Heat flow in areas without observations is predicted primarily from tectonic setting and tectono-thermal age, based on observed relationships between heat flow and geological age. The resulting global data field is evaluated on 5° × 5° regions and represented by spherical harmonics. This approach established the basic strategy subsequently used by several global heat-flow assessments: measured values where available and geologically based prediction where observations are absent.
Lee & Uyeda (1965)
Lee, W.H.K., Uyeda, S. (1965). Review of Heat Flow Data. In: Lee, W.H.K. (ed.), Terrestrial Heat Flow, Geophysical Monograph Series, Vol. 8, American Geophysical Union, pp. 87-190. doi:10.1029/GM008p0087
Data used:
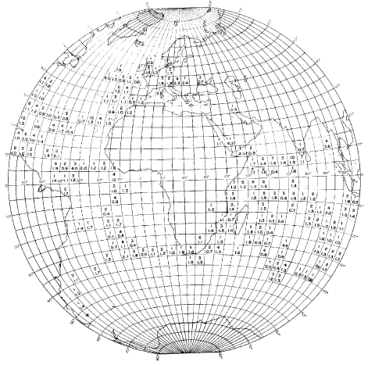
Mapping: Presents one of the earliest comprehensive global compilations and analyses of terrestrial heat-flow observations. The study assembled approximately 2,000 measurements and examined their geographical and tectonic distribution. It also contributed to early spherical-harmonic representations of the global heat-flow field. Unlike later global mapping studies, it did not provide a spatially complete prediction based on an explicit geological extrapolation framework; its principal contribution was the systematic global compilation and analysis of the available observations.